Chapter 4
Visualizing the stability of stationary points via phase line and slope fields.
Here we visualize the stability of stationary points for autonomous first-order ODE's using phase line and slope fields.
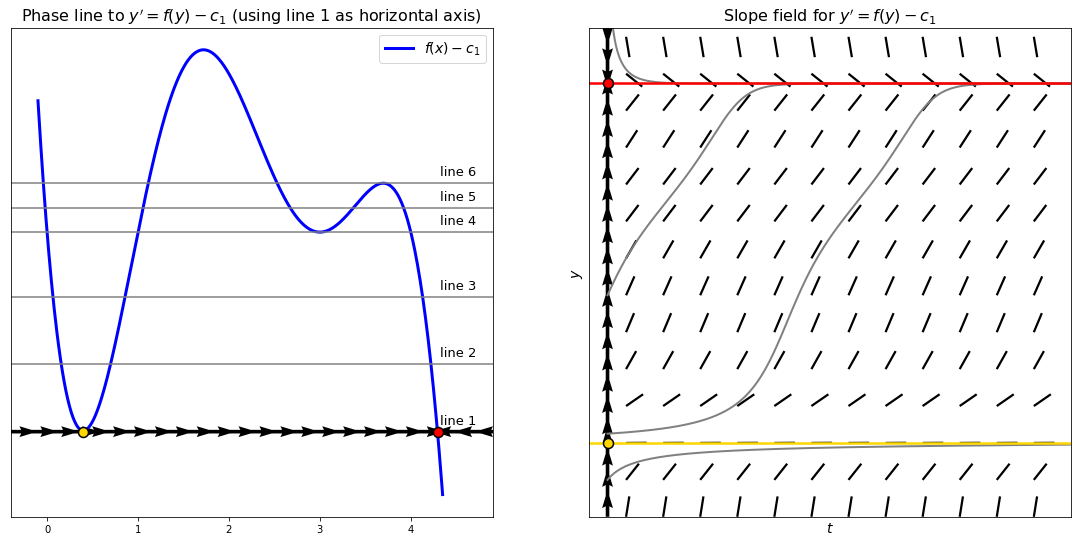
Example 1.
Here is a graph for a certain function $f$. Pick a line as your horizontal axis; the graph now becomes that of $f-c$ for some constant $c$. Then you can see the effect of such a change on the phase line and slope fields corresponding to the ODE $y' = f(y) - c$. (In the graph, green means unstable stationary point, red means stable stationary point, and yellow means semi-stable stationary point.)
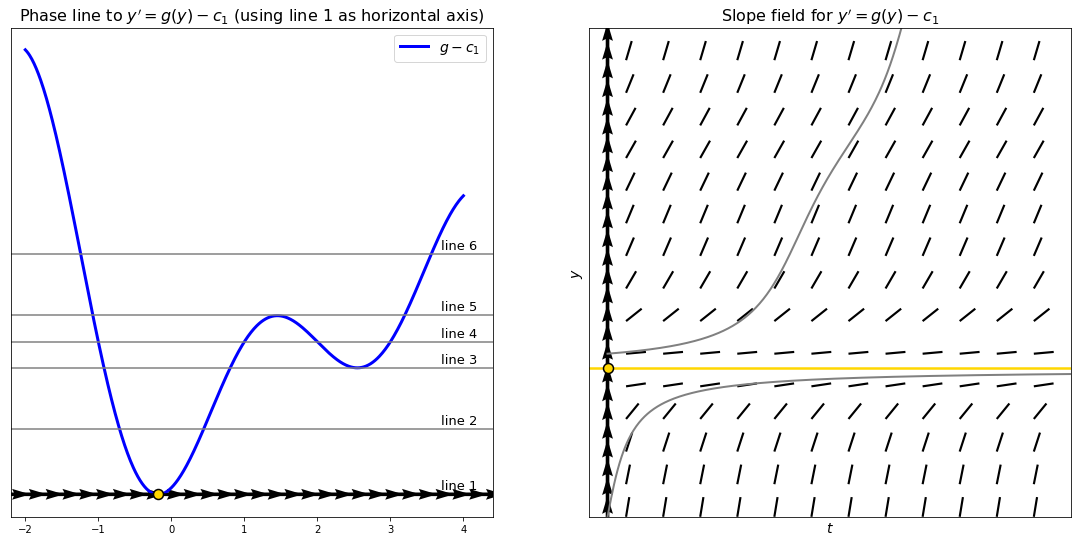
Example 2.
Here is a graph for another function $g$. Pick a line as your horizontal axis; the graph now becomes that of $f-c$ for some constant $c$. Then you can see the effect of such a change on the phase line and slope fields corresponding to the ODE $y' = f(y) - c$. (In the graph, green means unstable stationary point, red means stable stationary point, and yellow means semi-stable stationary point.)